Brand sentiment analysis that scores the video not just the caption
Know where your brand stands, understand what moved it, and see a shift while it is still forming. Clayface builds brand sentiment from what a video shows as well as what is said and written, with every score carrying the posts behind it.


Social Listening
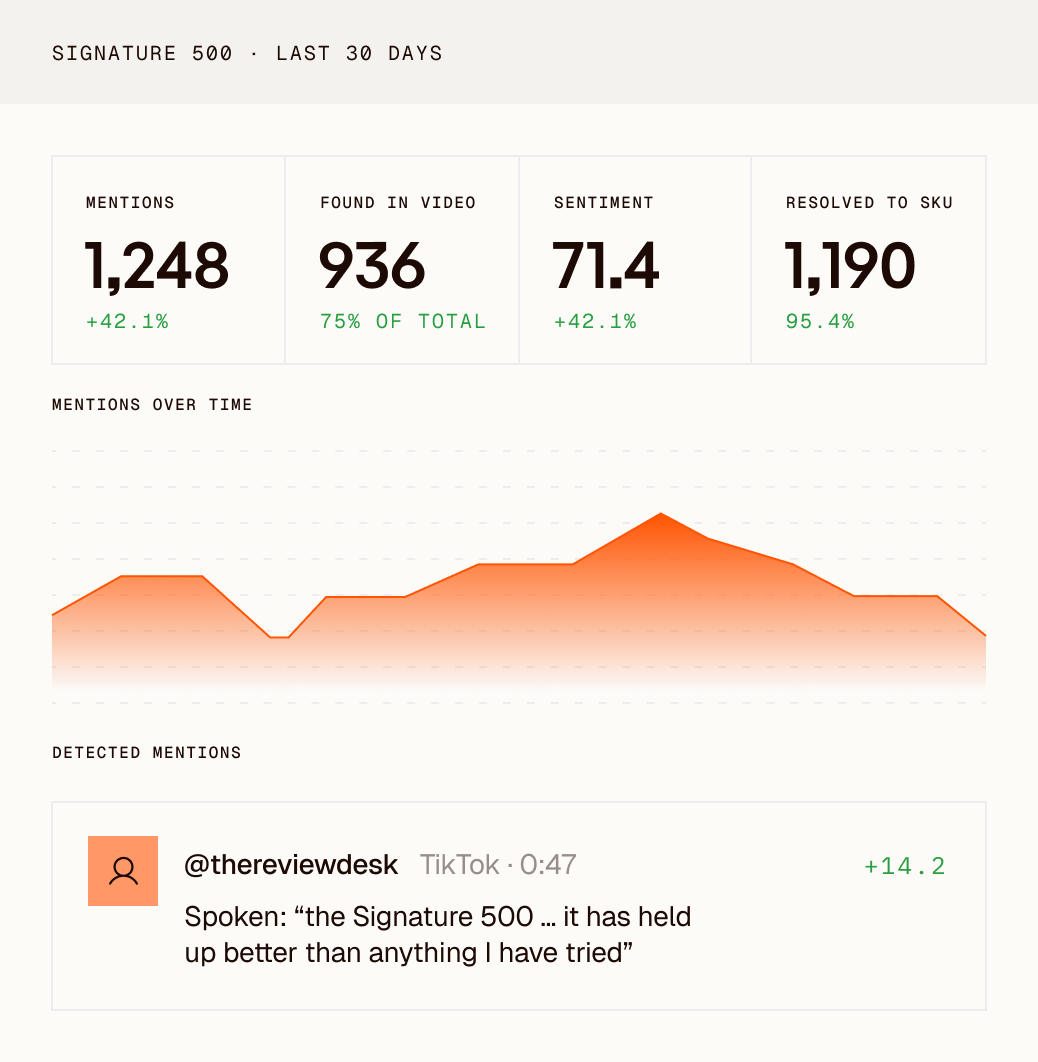
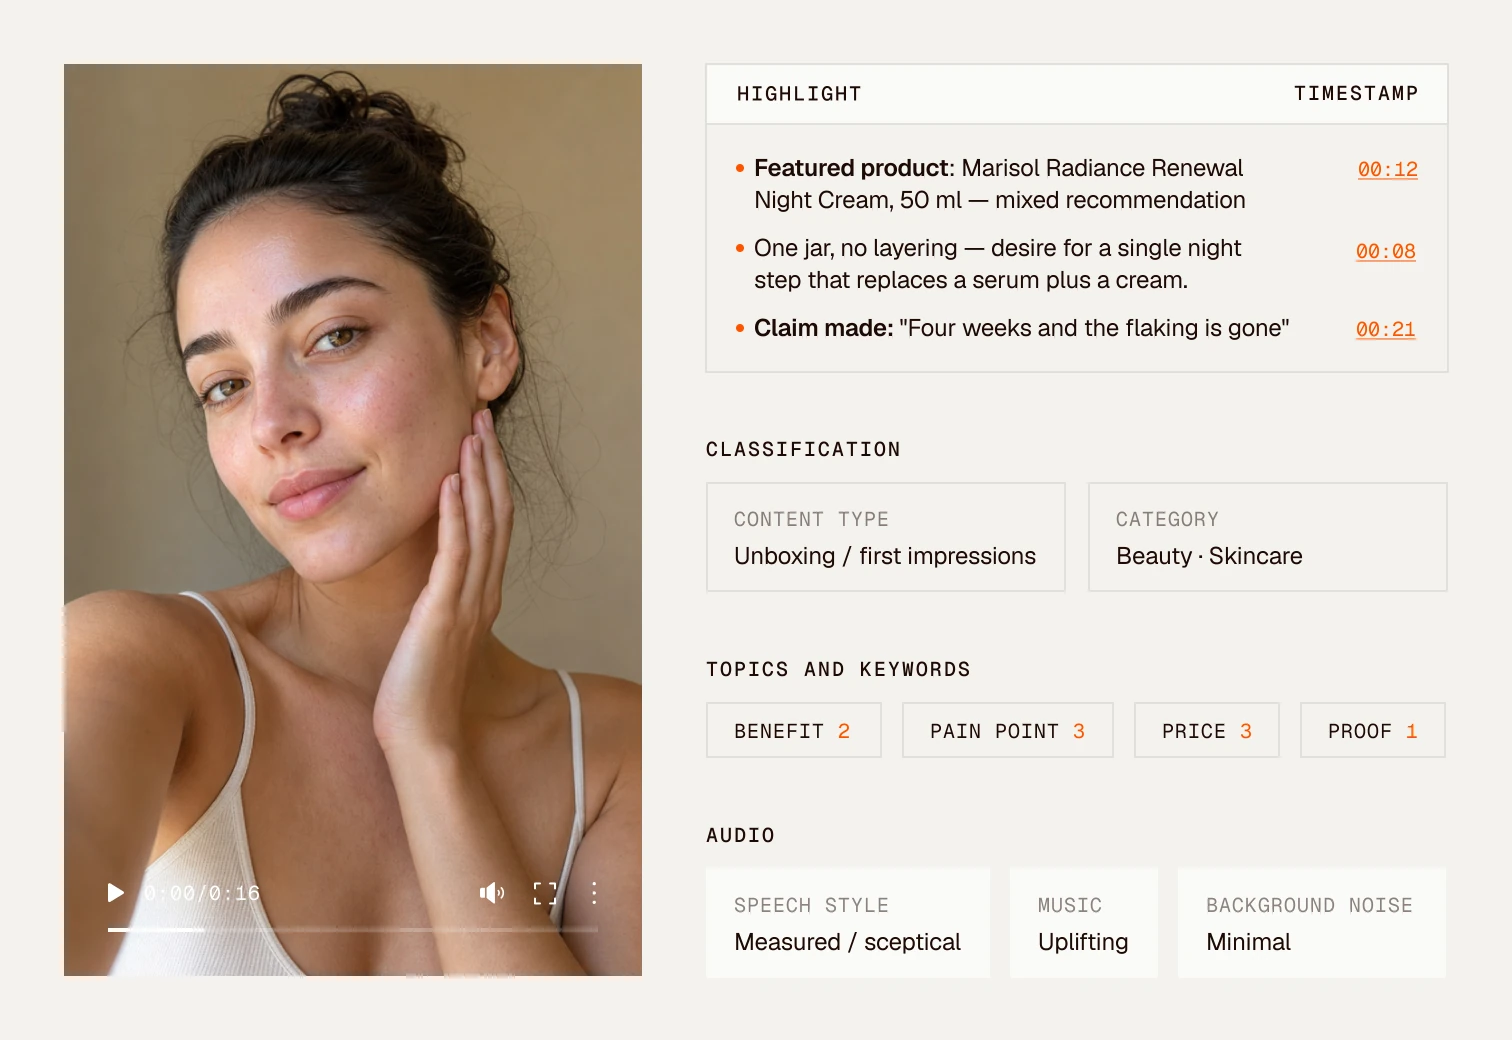
Track mentions across Instagram, TikTok, YouTube and X, along with video intelligence that equips you to read on-screen text, audio, products and logos inside the clip.
Learn more
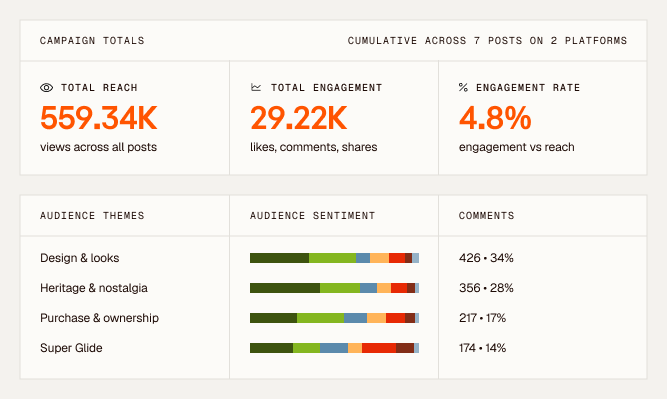

Brand Sentiment
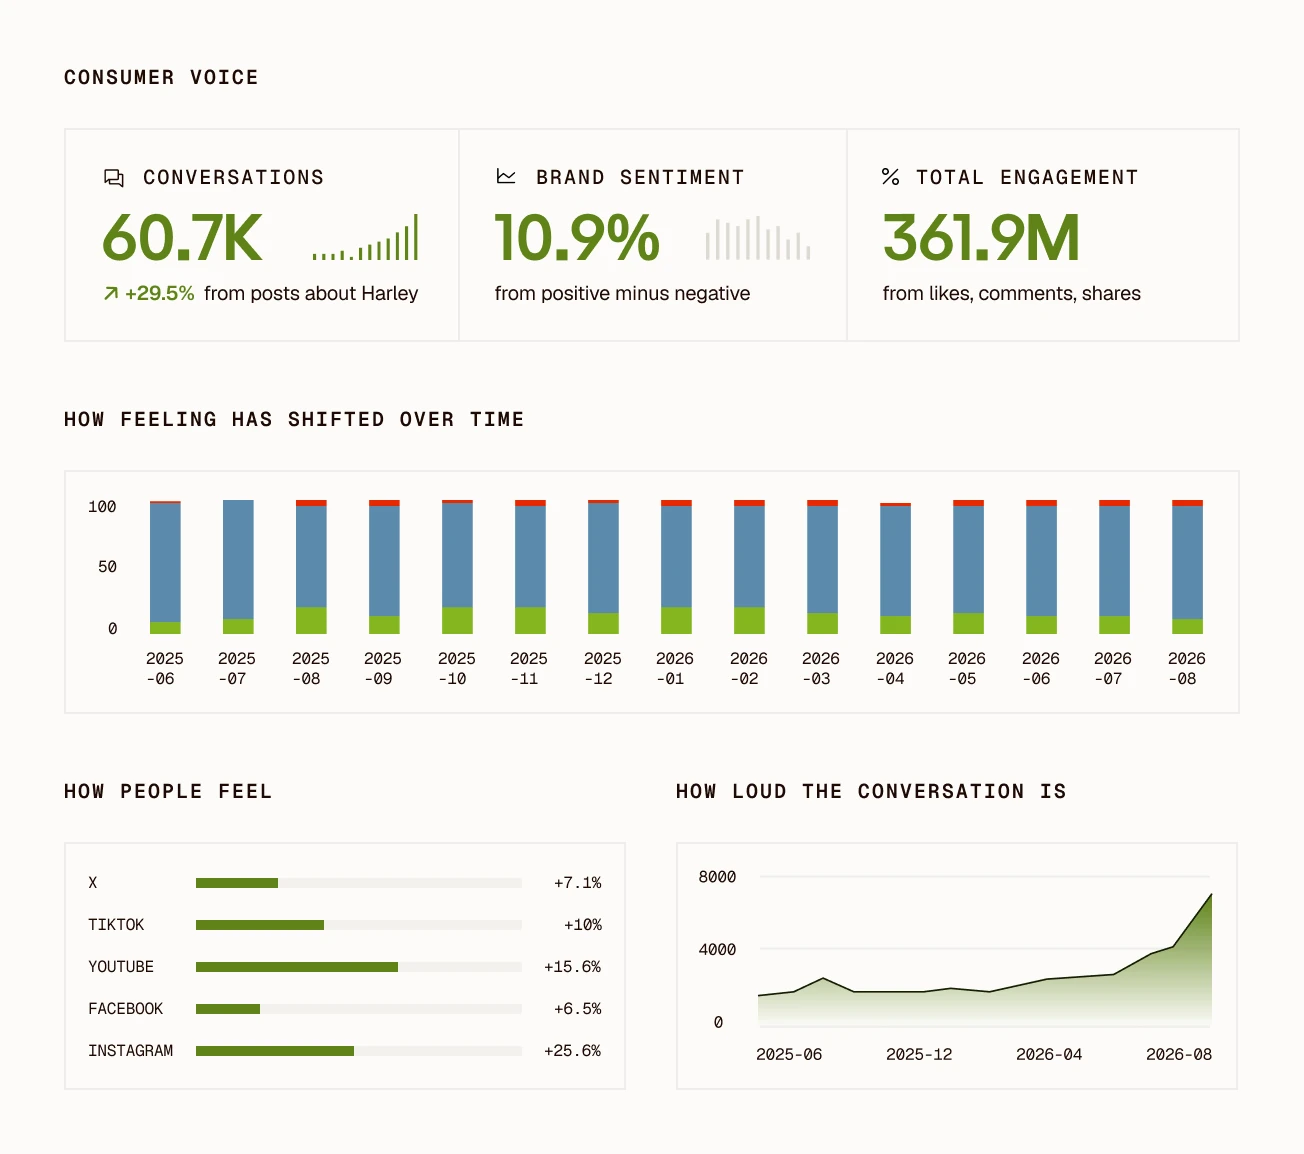
Every mention scored for sentiment and mapped over time, so you can see what moved the needle and when the mood shifted.
Learn more
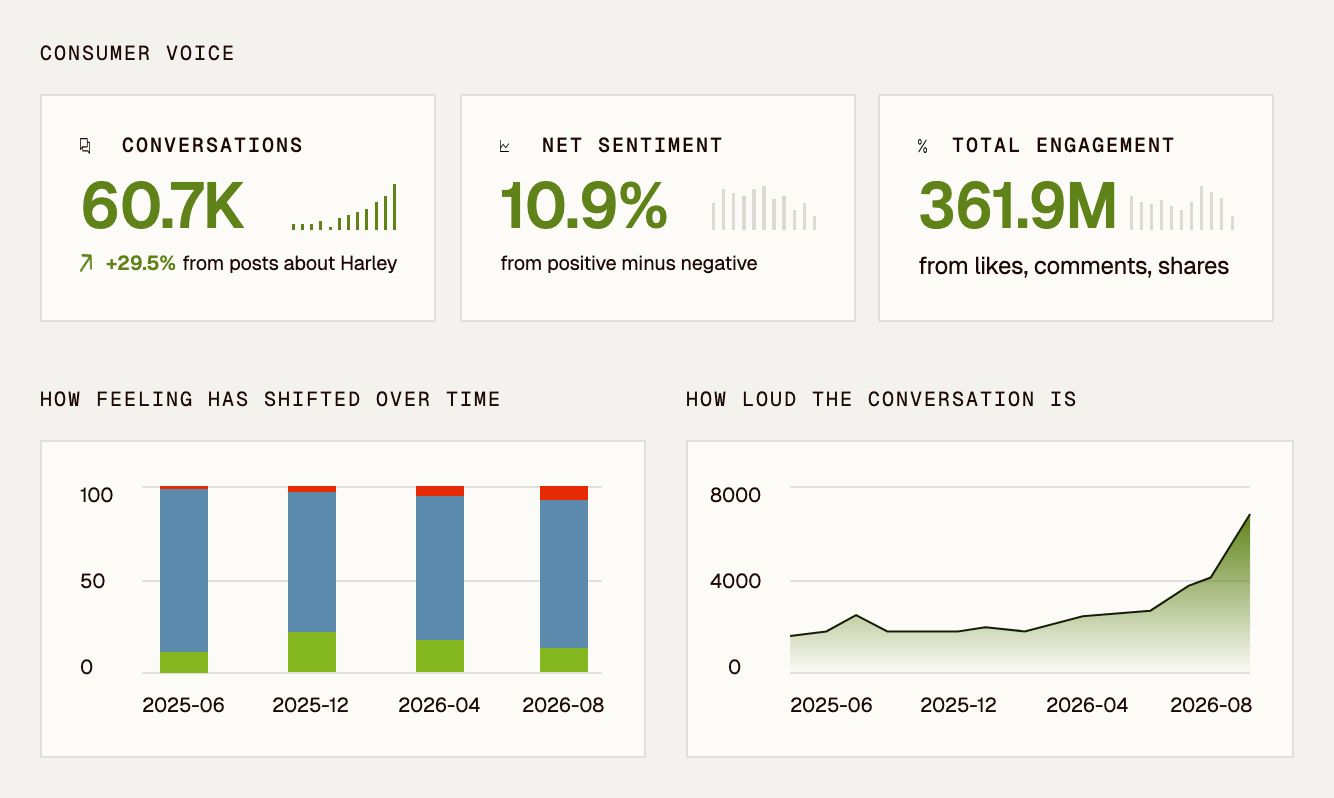

Voice of Customer
Every mention scored for sentiment and mapped over time, so you can see what moved the needle and when the mood shifted.
Learn more
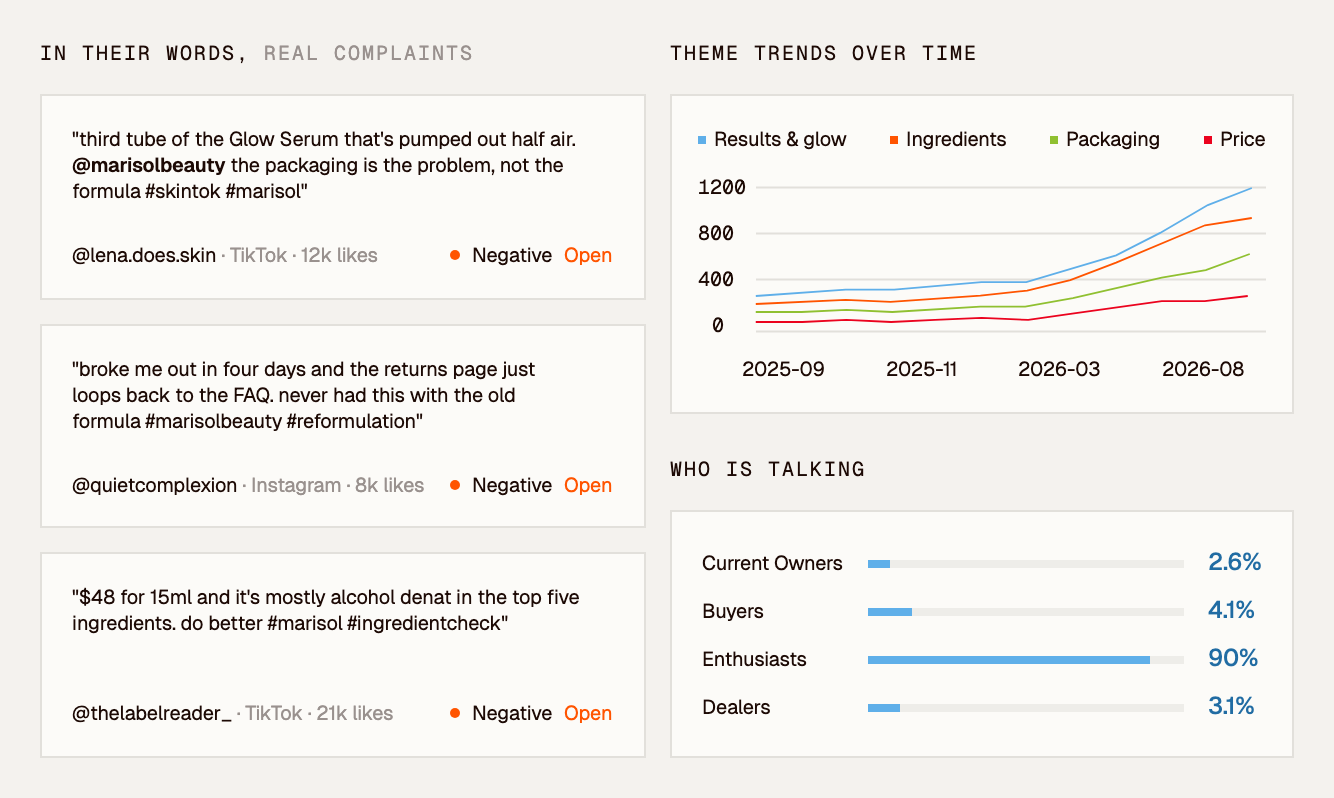

Competitor Analysis
Benchmark share of voice, engagement and sentiment against any competitor. Spot their launches, gaps and unhappy customers as they surface.
Learn more
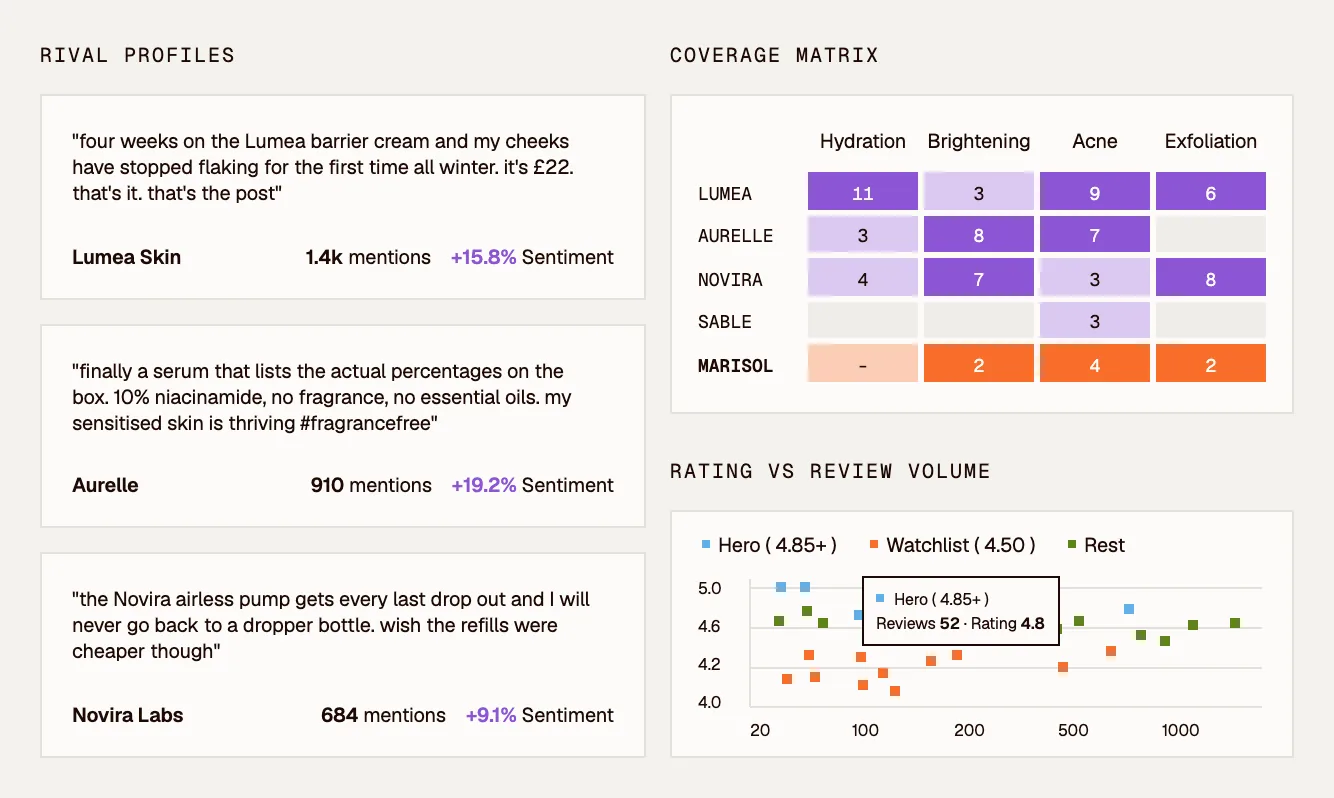











What brand sentiment analysis tells you
Sentiment coverage
Brand sentiment scored across every platform and layer
Written posts, comments, spoken audio, on-screen text and the video itself all feed one score for the period, across 25+ platforms.
Sentiment drivers
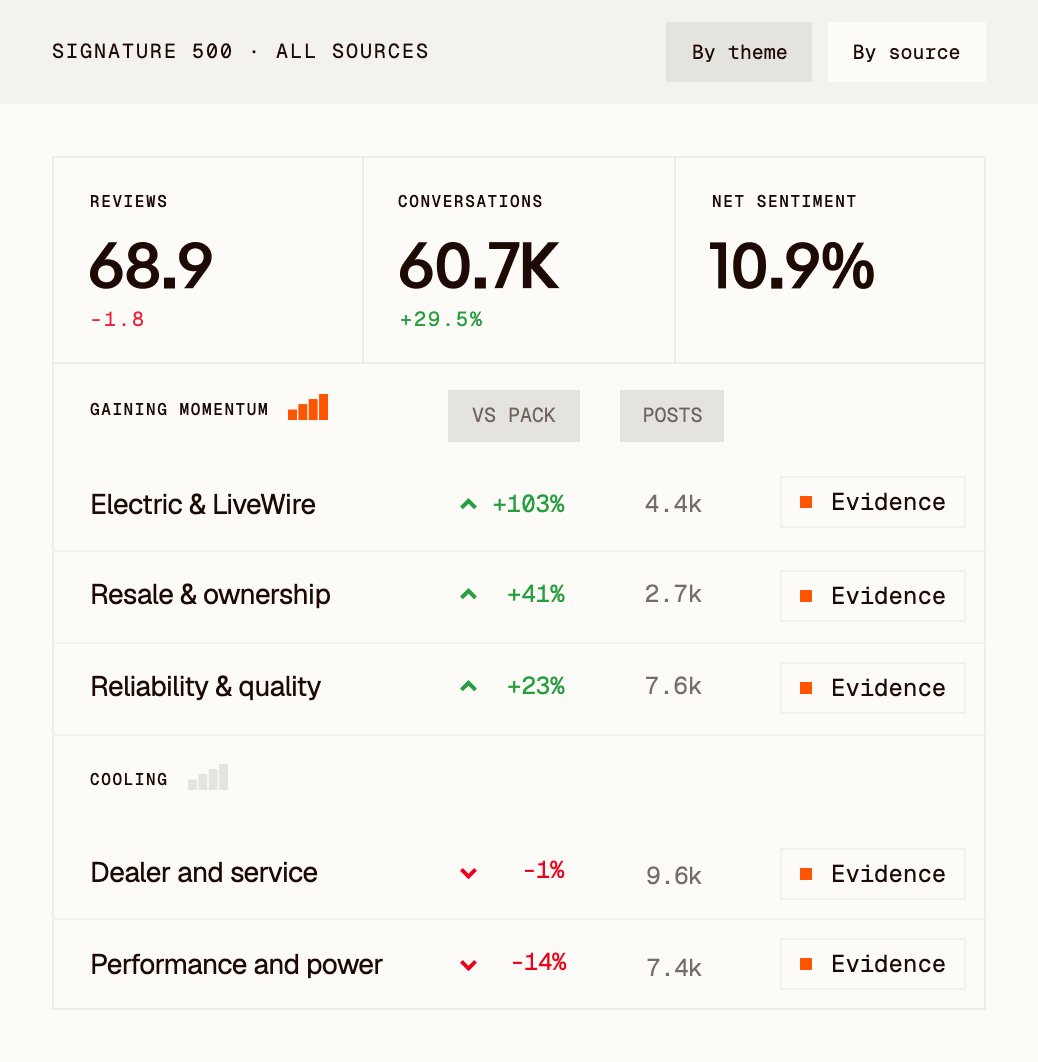
Sentiment score broken down by theme
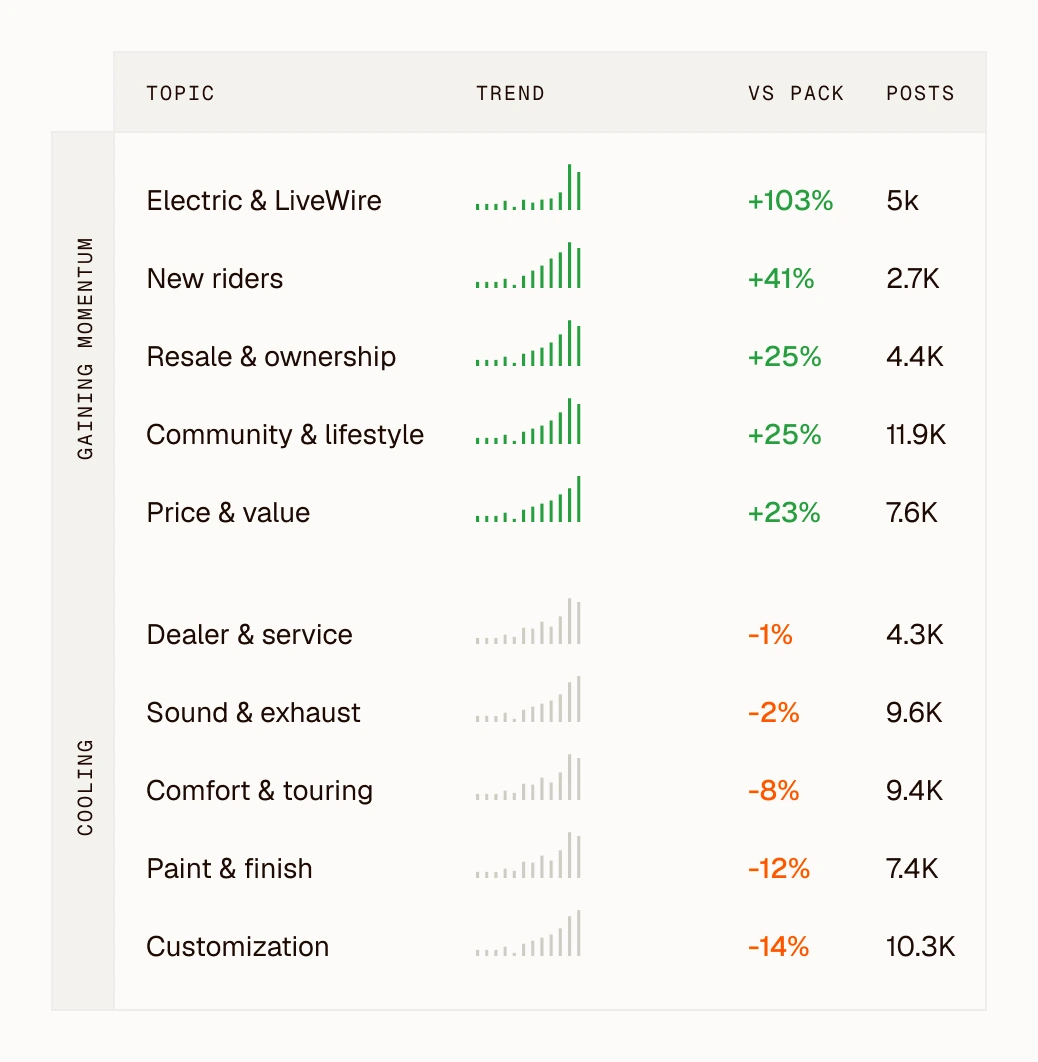
Each score breaks into the themes behind it, ranked by how far each moved the number. Shipping, fit and price stay separate rather than averaged.
Sentiment tracking
Brand sentiment tracking week by week
Movement is measured against the period before, so a decline shows in the days it starts rather than the month it is reported. The posts that began it come attached.



475M+
creators database
25+
Social media platforms covered
5B+
Signals processed monthly


Why Our Customers Believe Us
“Our old tool showed us maybe a fifth of the campaign. Clayface picked up creators talking through the product for a full minute without ever typing the brand name in the caption. That changed what we thought the campaign had actually done.”
“The video breakdown was the moment it landed. Screen time, what was said, what was visible, sentiment, all on one view. Nothing else we looked at could tell us which part of the video the reaction was to.”
“We were rebuilding the same competitor sentiment comparison by hand every month. Now it runs on a schedule and the numbers hold up when someone asks where they came from.”